There are many tools out there to help monitor and alert on AWS accounts, both native and third-party. Across every tool I have tested, one alert is always critical and it’s so easy to fix that there is no excuse not to have it on — CloudTrail.
CloudTrail, in short, logs every API call in your AWS account. The importance of this should be self-evident to my readers, so bear with me. If something bad happens in your account, you want to know who did it and when. You want an audit trail! Without CloudTrail, you’ll be flying without a rear-view mirror. You won’t have any hindsight to be 20-20 about, and that’s a shame.
At what cost? Basically the cost of storing the data in S3 and CloudWatch — minimal. If you’re not sold and you’ve read this, I’ll have no sympathy.
Moving on.
Historically, CloudTrail was enabled per region. This means that when a new region comes online, you must remember to go and enable it in that region. If you don’t automate this, there is room for neglect. CloudTrail now has an ‘all-regions’ setting per trail. My recommendation is create a new trail that has all-regions enabled. If this is as far as you go, that’s okay, but we can take it a step further.
At this point, you’ll have an S3 bucket that is logging all API calls across all regions, and in the event a new region comes online, that region too. Additionally, you can pipe these logs through CloudWatch, which I recommend. Typically, most customers only use 1-3 regions, so if you have non-readonly activity in any of the other regions, you probably want to be alerted. I’m going to walk you through setting up alerts to answer the following question:
How can I be alerted of any activity in non-approved regions, with the exception of read-only calls?
- I assume you already have a CloudTrail log enabled for all regions, pushing to S3 and CloudWatch.
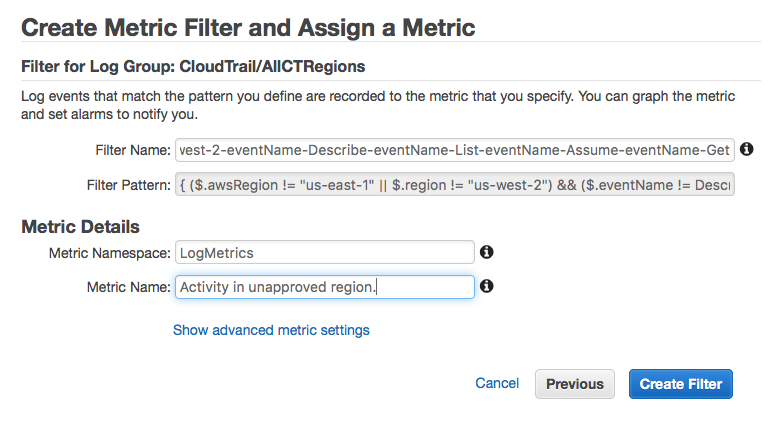
- In CloudTrail, navigate to the Logs and highlight the CloudTrail logs, click “Create Metric”, with the following settings:
- The following code assumes you only leverage us-east-1 and us-west-2. Any non-read activity in any other region should trigger an alert (adjust per use-case). Filter code:
{ ($.awsRegion != "us-east-1" || $.region != "us-west-2") && ($.eventName != Describe* && $.eventName != List* && $.eventName != Assume* && $.eventName != Get*) } - Name it something sensible and create the filter.
- The following code assumes you only leverage us-east-1 and us-west-2. Any non-read activity in any other region should trigger an alert (adjust per use-case). Filter code:
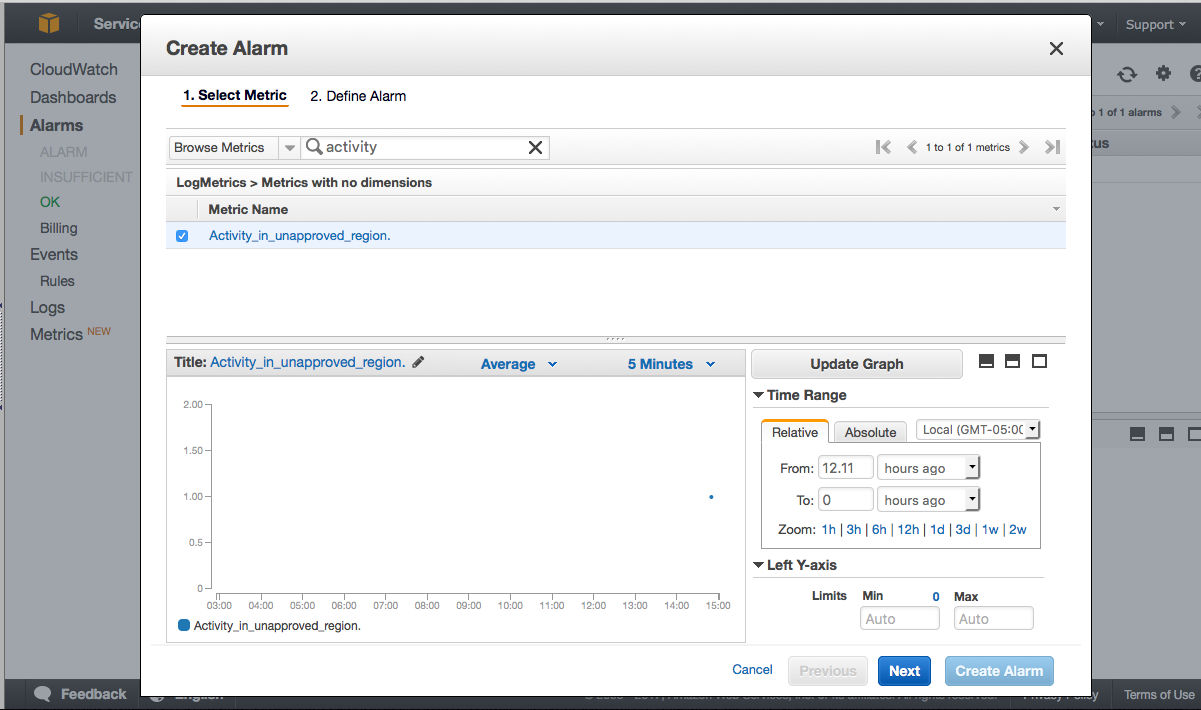
- Next, create an alarm within CloudWatch. You may need to search for your new metric. If it isn’t found, give it 5 minutes.
- Use the following settings for your new alarm:
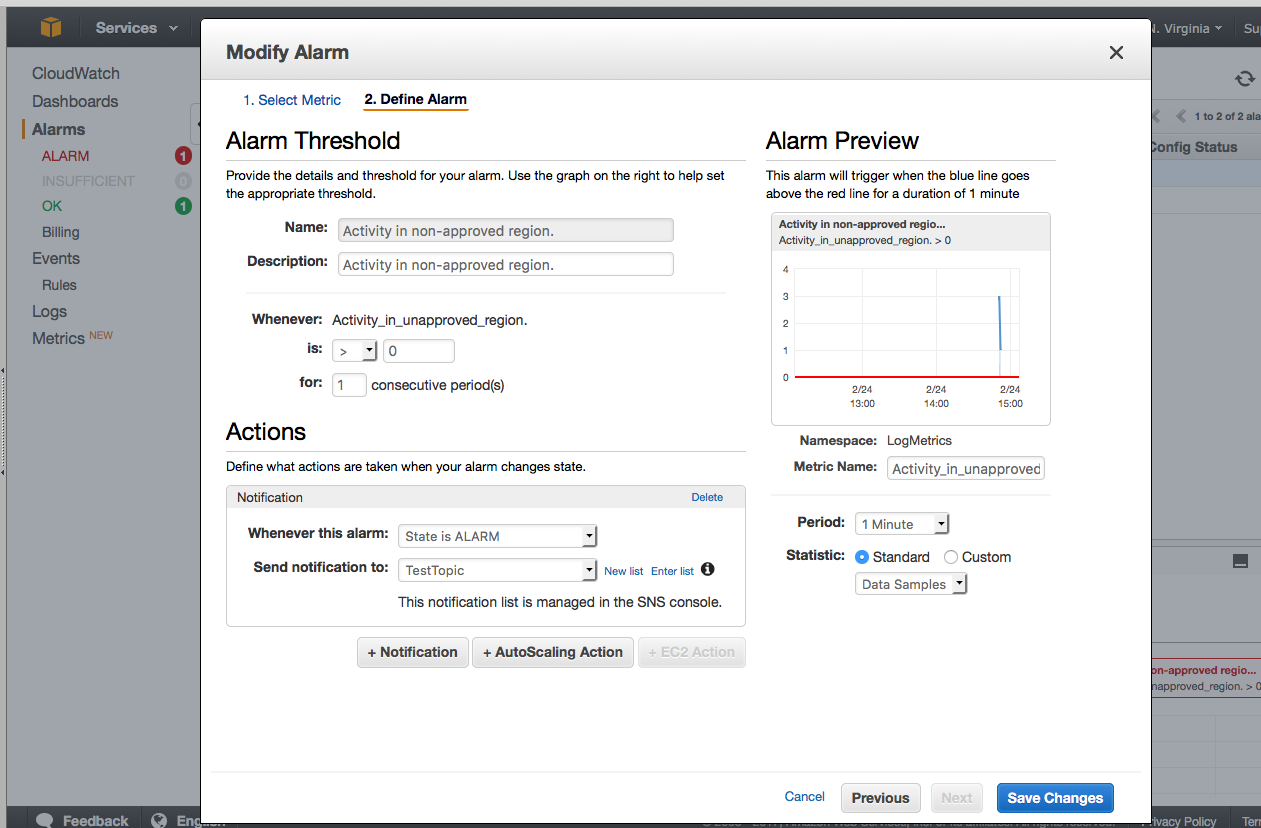
- You can see that I already had some activity, but at this point, you should navigate to a non-approved region and run a test.
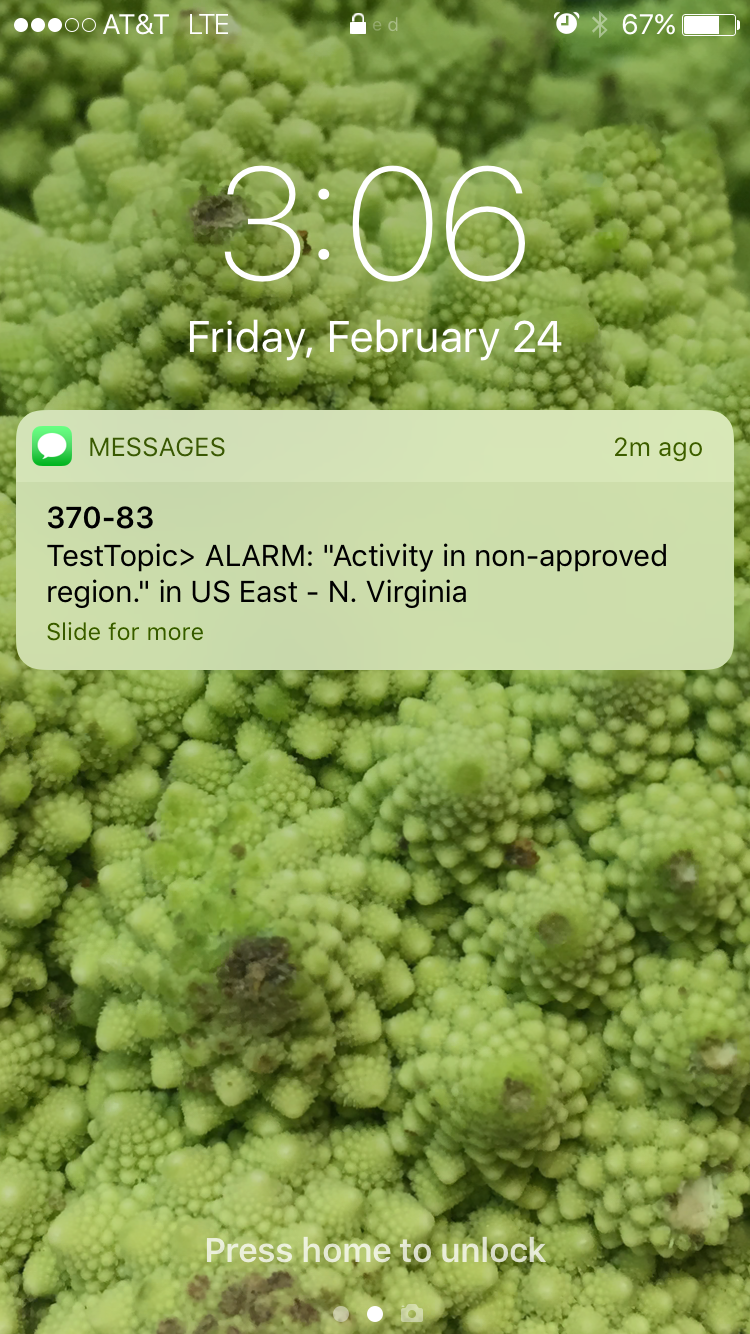
- I used TestTopic that pushes to my mobile, and you can see here that it worked:

- That’s it!
To wrap up, I’d like to note that this solution is a simple one to a pointed problem. If you want to ask more complicated questions, be more exploratory with your logs, or fins yourself wanting greater functionality, you should consider some of the following technologies in your solution: Stream your logs to Lambda or Elastisearch. Try querying your logs directly from S3 with Athena. Be creative and open-minded to what technologies to use for each use case. My solution here is a simple solution to a simple question.
Any questions or clarification needed? Reach out to me.
Cheers!